
| Anishinaabemowin Dialect Maps |
| Home | Grammar Contents | Previous | Next |
The maps on the following pages were all compiled by me (R. Valentine) as part of a study of Canadian Ojibwe dialects, which became my Ph.D. dissertation (R. Valentine 1995), to be published by the University of Nebraska Press in 2001. My research was organized around a questionnaire based on the extensive dialectological knowledge of John Nichols. I took the questionnaire across Canada in a whirlwind tour from Quebec to Alberta, driving a truck from one Anishinaabe community to another, stopping into band offices to get permission to carry out work, and arranging to meet local elders to record dialect materials. At the end my journey, I had material from just over 50 communities, including items of variant pronunciation, vocabulary, and various grammatical features. For a complete list of the communities I visited, click anywhere on the map below (you can do this on any dialect map).
Basic Layout of Maps. The following map shows the words I got from different communities for the translation of 'barks,' as in 'that dog barks a lot.' Each community is identified with a two letter code, which is followed by the variants attested for that community. (Click on the map to open a table of communities).
 |
First, note that there are two basic responses (called
variants): speakers reported their communities
to say either migi or migine.
Communities where migi is used are marked with
a black triangle, |
|
|
Each datasite is identified with a two-letter community code, followed by whatever variant was found at that location. To the left, for example, we see that both PC (Pine Creek, Manitoba) and SM (Lake St. Martin, Manitoba) used migi, because both communities have a black triangle associated with them. |
 |
Below the map is an English gloss, here, Barks e.g., a dog), followed by a grammatical code, VAI (for verb, animate intransitive). Below the English gloss are my own analytic notes, and pertinent data from other languages, when they are available. |
|
On the lower right side of the maps, there are two additional kinds of information: variant community groupings and consolidations. Community groupings simply list all the communities showing a given variant, in alphabetical order (of community codes). The variant period (.) is used when I lack data for a given community, such as RP above. Consolidations are groupings of variants into variant families. Here, for example, I consider migi and migine similar enough to consolidate them together. Other maps show different consolidations. Consolidations allow me to make fine distinctions of variants for some purposes, but at the same time, to look for patterns of more abstract variation (consolidations) as well. |
Analyzing Maps. Now look at the distribution of the triangles and circles on the map (reproduced below). Is the geographical distribution random, or does it show regional patterning? Notice that the form migine is found in a northern area of Ontario and Quebec; elsewhere (i.e., in the south), migi is found. Dialectologists draw lines to show shared dialectological features. These lines are called isoglosses. The map below has been marked with an isogloss:
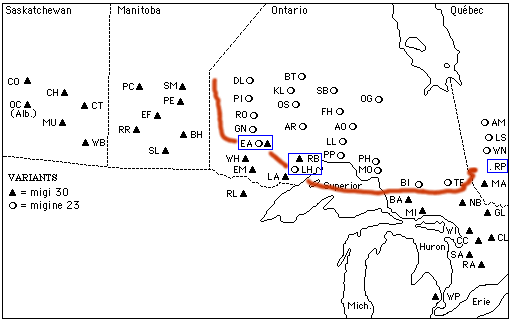
Notice that the community of EA (in western Ontario, enclosed within a blue box) has both forms, and so the isogloss line essentially cuts right through it. This is often the case for communities on the borders of dialects, since it is not uncommon for them to use forms from both dialects. Note too that there is a kind of "flipping" of the expected distribution of forms in the two communities of RB and LH (on the northwest shore of Lake Superior, again within a blue box). This too is not surprising at a dialect boundary, though it could simply reflect incomplete data, a very common problem in dialectological studies, and certainly true of my data. Next, notice that we run into a problem in the extreme eastern region, where we lack data for RP (indicated with a period (.) for a missing data value), which just happens to stand right on the border between the two groups of communities. So our isogloss just whimpers into vagueness at this point because we lack data.
Inspecting these data in more general terms, we see some interesting features of distribution. For one, there is a fairly clear alignment of most of the communities in northern Ontario with a broad northern swath cutting across the north shore of Lake Superior all the way to Quebec. In the prairie provinices of Manitoba and Saskatchewan, however, the "southern" form (migi) is used. This accords with historical accounts in which the Anishinaabeg moved west with the expansion of the fur trade in the 17th-19th centuries, following a route that took them through the boundary waters region of the Minnesota-Ontario border, over to Lake Winnipeg (sadly, not shown on my maps) in Manitoba, and from there west across the Canadian prairies. At the same time we see an ancient north/south alignment in the east. To some extent this north/south alignment was reinforced by the alliances of the fur trade, in which southern Anishinaabeg tended to trade with the French, and northern, with the English.
The single isogloss line above captures the variation of a single item of vocabulary. Dialectologists examine the patterns existing among a large number of isoglosses, looking for alignments (bundles) that suggest the delimitation of dialects. The following map, for example, shows several isoglosses for different grammatical features of Anishinaabemowin.

The map shows a quite clearly structured alignment of features, cascading from north to south (or south to north!), creating for us the beginnings of a picture of Anishinaabemowin dialect affiliations. For example, we can see that the communities in far northern Ontario (such as DL, KL, and BT) agree in every feature with the communities in northern Quebec (AM, LS, WN, etc.). We can see that all of the communities in Manitoba and Saskatchewan agree with the more southerly communities. Shared behavior suggests closer relationship, and there tends to be more diversity in longer-settled areas than recently settled, assuming that settlement is by a more or less linguistically homogenous group. This seems to confirm the westward advance of Anishinaabe people, not too long ago, from the southeast.
Making Connections. We will inspect one more map and make observations about dialect groupings, on the following page. As you look for patterns on the many maps which follow, be sure to keep in mind the basic outline of Anishinaabemowin dialects (click the map image below to open the main dialect map in another window). Click next to continue on to the next page, or back to top to return to the top of this page.
